Datadog
Disclaimer
Your use of this download is governed by Stonebranch's Terms of Use.
Version Information
Template Name | Extension Name | Version | Status |
|---|---|---|---|
Datadog | ue-datadog | 1 (Current 1.0.0) | Initial version. |
Refer to Changelog for version history information.
Overview
Datadog is a cloud-based observability and monitoring platform that provides metrics, logs, traces, and alerting across infrastructure, applications, and services. It offers a unified view of system health through its REST API, enabling programmatic interaction with events, monitors, and log pipelines.
This integration connects Universal Automation Center (UAC) to the Datadog platform, allowing tasks to send telemetry and monitor system health from automated workflows.
Key Features
Feature | Description |
|---|---|
Post Event | Post Event creates a Datadog event from a UAC task instance. |
Get Monitor Status | Get Monitor Status queries one or more Datadog monitors and optionally fails the task if any monitor is in an alert or no-data state. |
Post Log | Post Log sends a structured log entry to the Datadog log-intake endpoint. |
Configurable Failure Conditions | Get Monitor Status can be configured to fail the task when any monitor is in Alert or Warn state, or when any monitor has no data. |
Structured UAC Output Fields | Each action writes results to UAC output fields ( |
Requirements
This integration requires a Universal Agent and a Python runtime to execute the Universal Task.
Area | Details |
|---|---|
Python Version | Requires Python 3.11, Tested with Agent bundled python distribution. |
Universal Agent Compatibility |
|
Universal Controller Compatibility | Universal Controller Version >= 7.7.0.0. |
Network and Connectivity | Connectivity to Datadog API endpoints and log-intake endpoints is required. The specific hostname depends on the configured Datadog site. |
Datadog | Compatible with Datadog Events API v1, Monitors API v1, and Logs API v2. |
Supported Actions
Action: Post Event
Posts an event to Datadog.
Action Output
- EXTENSION
- STDOUT
The extension output provides the following information:
exit_code, status_description: General info regarding the task execution.invocation.fields: The task configuration used for this task execution.result.event_id: The integer ID assigned to the event by Datadog.result.event_title: The title assigned to the event by the user.result.status: The status returned by the Datadog API.
Examples:Successful execution
Failed execution — authorization error
Displays a summary table of the posted event.
Example:
  Post Event Info
  =====================
  ╭────────────┬──────────────────────╮
  │ Title      │ Datadog UC1 Workflow │
  ├────────────┼──────────────────────┤
  │ Event ID   │ 8641802910174914324  │
  ├────────────┼──────────────────────┤
  │ Alert Type │ info                 │
  ├────────────┼──────────────────────┤
  │ Priority   │ normal               │
  ╰────────────┴──────────────────────╯
Action: Get Monitor Status
Queries one or more Datadog monitors.
Action Output
- EXTENSION
- STDOUT
The extension output provides the following information:
exit_code, status_description: General info regarding the task execution.invocation.fields: The task configuration used for this task execution.result.monitors: List of queried monitor objects, each containingid,name,overall_stateandtype.result.summary: Counts of monitors in each state:ok,alert,warn,no_data,other.result.any_alerting: Boolean indicating whether any monitor is in Alert or Warn state.
Examples:Successful execution — all monitors OK
Failed execution — monitor in alert state
Displays a table of monitor names, IDs, states and types.
Example:
  Monitor Status Report
  =====================
  ╭───────────┬──────────────┬──────────┬───────────╮
  │ ID        │ Name         │ Status   │ Type      │
  ├───────────┼──────────────┼──────────┼───────────┤
  │ 283054239 │ Test Monitor │ OK       │ log alert │
  ╰───────────┴──────────────┴──────────┴───────────╯

  Summary: 1 OK, 0 Alert, 0 Warn, 0 No Data
Action: Post Log
Sends a structured log entry to the Datadog log-intake endpoint.
Action Output
- EXTENSION
- STDOUT
The extension output provides the following information:
exit_code, status_description: General info regarding the task execution.invocation.fields: The task configuration used for this task execution.result: Information about the posted log includingstatus,log_message,ddsource,service,hostname,log_status,tagsandcustom_attributes.
Examples:Successful execution
Failed execution — reserved key conflict in custom attributes
Displays a summary table of the submitted log entry.
Example:
  Post Log Info
  =====================
  ╭─────────┬──────────────────────────────────────╮
  │ Message │ Datadog UC1 Workflow Status: started │
  ├─────────┼──────────────────────────────────────┤
  │ Source  │ stonebranch                          │
  ├─────────┼──────────────────────────────────────┤
  │ Status  │ info                                 │
  ╰─────────┴──────────────────────────────────────╯
Configuration Examples
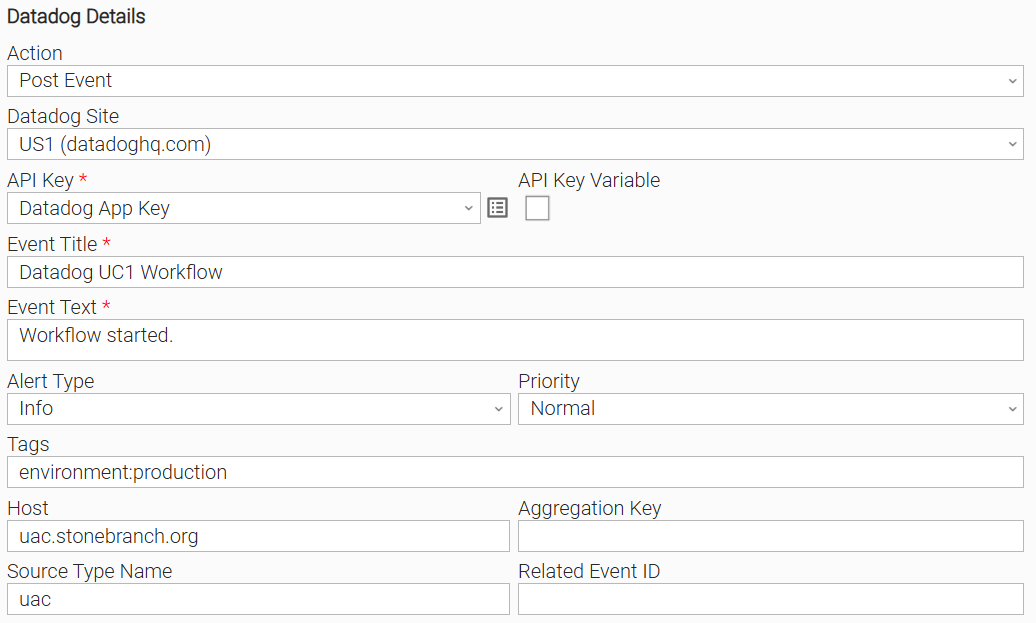
Example: Post a Datadog Event
The task posts a Datadog event with title "Datadog UC1 Workflow" and alert type "Info". The task completes when the event is accepted by the Datadog API. On success, the assigned event ID is available in the event_id output field.
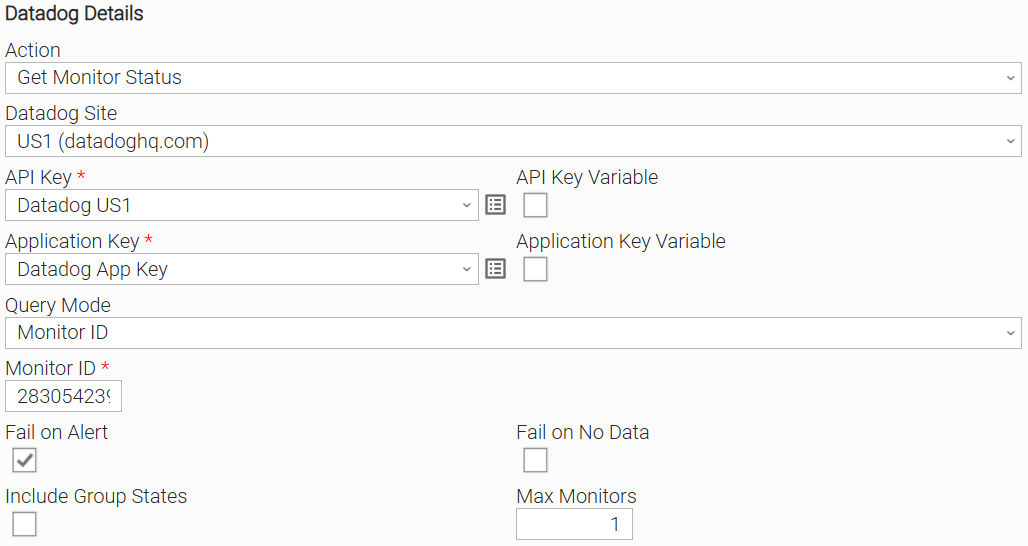
Example: Get Monitor Status
The task queries a Datadog monitor by Monitor ID, with Fail on Alert enabled. If the monitor is in Alert or Warn state, the task ends with failure, allowing downstream UAC tasks to gate on monitor health.
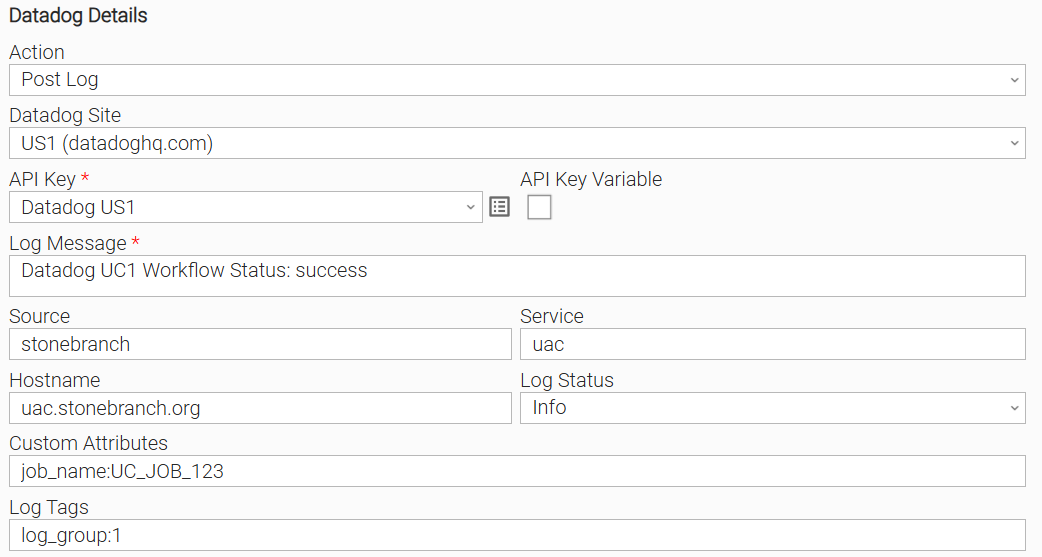
Example: Post a Log Entry
The task posts a log entry with status "Info" to the Datadog log-intake endpoint. Custom attributes are specified as key:value pairs.
Importable Configuration Examples
This integration provides importable configuration examples along with their dependencies, grouped as Use Cases to better describe end-to-end capabilities.
These examples aid in allowing task authors to get more familiar with the configuration of tasks and related Use Cases. Such tasks should be imported in a Test system and should not be used directly in production.
Initial Preparation Steps
- Download and import the extension template.
- Download and import the UAC Utility: Web Service template.
- Upload definition files in the following order
- Credentials
- Variables
- Tasks
- Workflows
The order indicated above ensures that the dependencies of the imported entities need to be uploaded first.
All imported entities are prefixed accordingly (for example: UC1 for Use Case 1, and UC2 for Use Case 2).
Use Case 1: Datadog Workflow Observability
Description
This use case demonstrates end-to-end workflow observability by integrating Datadog logging and events throughout a multi-step workflow.
Datadog events are posted at the start and end of the workflow to mark its lifecycle, while Datadog logs are sent after each intermediate step to provide granular visibility into the workflow's progression.
The web service task in the center of the workflow acts as the main point of failure and determines the overall outcome. The Linux tasks serve as status-printing steps that echo the same information as the logs and also act as placeholder tasks representative of steps in a customer's own workflows.
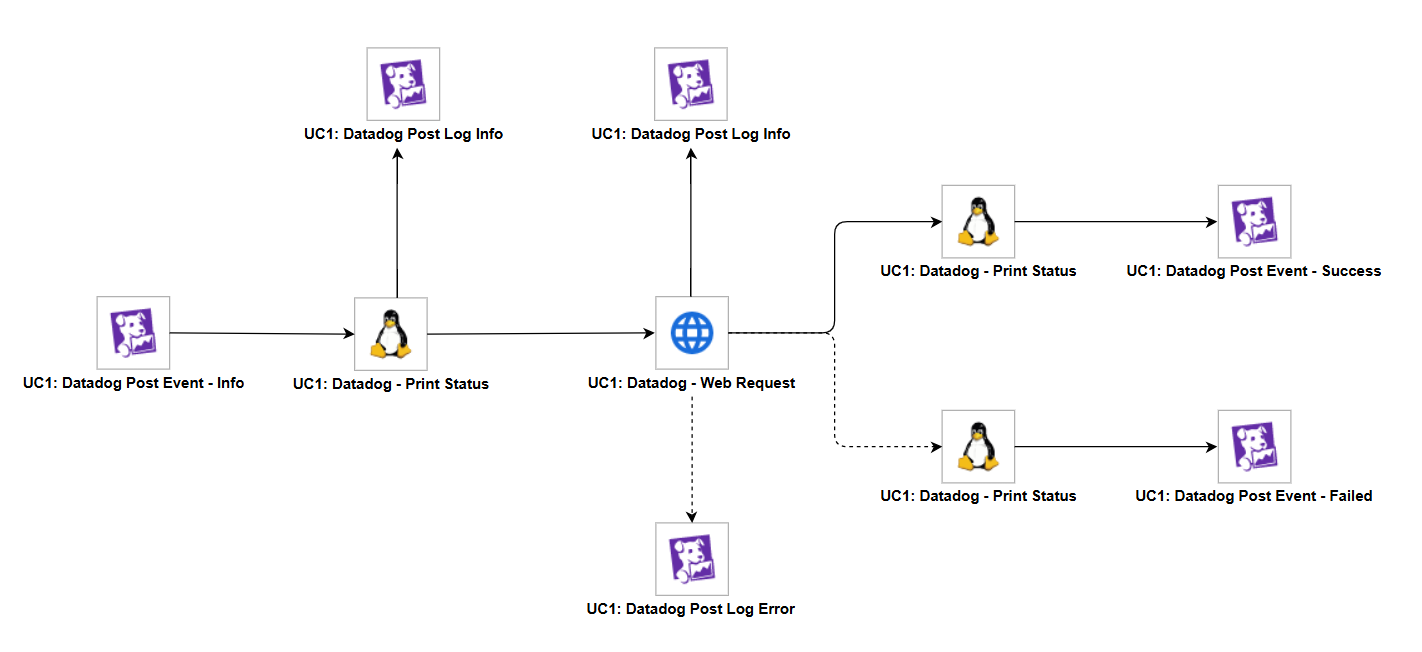
The workflow consists of the following components:
- "UC1: Datadog Post Event - Info" — Posts an informational Datadog event to signal that the workflow has started.
- "UC1: Datadog - Print Status" — A Linux task that prints the current workflow status to standard output.
- "UC1: Datadog Post Log Info" — Posts an info-level log to Datadog after the Print Status step completes.
- "UC1: Datadog - Web Request" — A Web Service task that performs an HTTP request. This is the primary task in the workflow and determines the success or failure path.
- "UC1: Datadog Post Log Info" — Posts an info-level log to Datadog after the Web Request completes.
- "UC1: Datadog Post Log Error" — Posts an error-level log to Datadog if the Web Request fails (failure path only).
- "UC1: Datadog - Print Status" — A Linux task that prints the final workflow status (success or failure).
- "UC1: Datadog Post Event" - Success — Posts a Datadog event indicating the workflow completed successfully (success path only).
- "UC1: Datadog Post Event" - Failed — Posts a Datadog event indicating the workflow has failed (failure path only).
How to Run
- Verify that all the imported Datadog variables are configured correctly.
- Navigate to the UC1: Datadog - Web Request workflow in the Universal Controller.
- Launch the workflow by right-clicking and selecting Launch.
Expected Results
- A Datadog event is created at the start of the workflow indicating execution has begun.
- Info-level logs are posted to Datadog after each intermediate step, providing step-by-step visibility.
- The Web Service task executes the HTTP request and determines the workflow outcome.
- On success, a final Print Status task runs and a Datadog success event is posted.
- On failure, an error-level log is posted to Datadog, a final Print Status task runs, and a Datadog failure event is posted.
- All logs and events are visible in the Datadog console for monitoring and alerting purposes.
Use Case 2: Automated Deployment Health Verification
Description
This use case demonstrates automated deployment health verification by querying Datadog monitors before allowing downstream deployment activities to continue.
The workflow simulates a deployment pipeline where an artifact is built, deployed to a test environment, and then validated against critical infrastructure monitors in Datadog.
If any monitor — such as API error rate, database replication lag, Kafka consumer lag, Kubernetes pod health, or disk saturation — is in an alert state, the workflow automatically halts and triggers incident creation. If all monitors report OK, the workflow proceeds to run smoke tests. The Linux tasks are lightweight placeholder steps that simulate real deployment pipeline stages, keeping the focus on the Get Monitor Status action and the resulting branching logic.
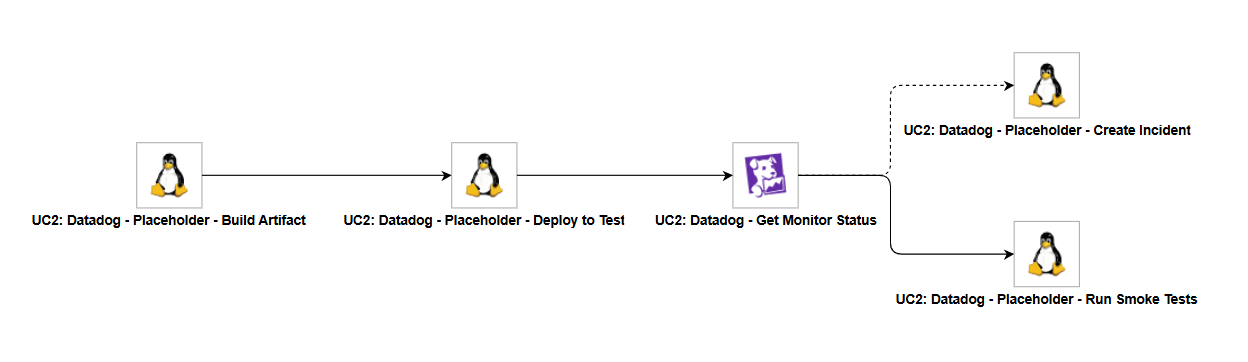
The workflow consists of the following components:
- "UC2: Datadog - Placeholder - Build Artifact" — A Linux task that simulates the build step of a deployment pipeline.
- "UC2: Datadog - Placeholder - Deploy to Test" — A Linux task that simulates deploying the built artifact to a test environment.
- "UC2: Datadog - Get Monitor Status" — The primary task that queries critical Datadog monitors (API error rate, database replication lag, Kafka consumer lag, Kubernetes pod health, and disk saturation) and determines the workflow outcome based on their status.
- "UC2: Datadog - Placeholder - Create Incident" — A Linux task on the failure path that simulates incident creation when any monitor is in an alert or no-data state.
- "UC2: Datadog - Placeholder - Run Smoke Tests" — A Linux task on the success path that simulates running smoke tests when all monitors report OK.
How to Run
- Verify that all the imported Datadog variables are configured correctly.
- Navigate to the UC2: Datadog - Get Monitor Status workflow in the Universal Controller.
- Launch the workflow by right-clicking and selecting Launch.
Expected Results
- The Build Artifact and Deploy to Test placeholder tasks execute sequentially, simulating the initial stages of a deployment pipeline.
- The Get Monitor Status action queries critical Datadog monitors (API error rate, database replication lag, Kafka consumer lag, Kubernetes pod health, disk saturation, etc).
- If all monitors report OK, the workflow follows the success path and proceeds to Run Smoke Tests.
- If any monitor is in an Alert state, the workflow follows the failure path and triggers the Create Incident step.
- The workflow outcome is fully determined by the real-time state of the Datadog monitors, demonstrating automated deployment gating based on infrastructure health.
Input Fields
Name | Type | Description | Version Information |
|---|---|---|---|
Action | Choice | The action performed upon task execution.
| Introduced in 1.0.0 |
Datadog Site | Choice | The Datadog site region. Determines the API and log-intake endpoint URLs.
| Introduced in 1.0.0 |
Custom API URL | Text | API base URL for a custom Datadog deployment (e.g., | Introduced in 1.0.0 |
API Key | Credential | Credential for authenticating with the Datadog API. Required for all actions. The Credential definition should be as follows.
| Introduced in 1.0.0 |
Application Key | Credential | Credential for the Datadog Application Key. This field is required and visible when the Action is "Get Monitor Status". The Credential definition should be as follows.
| Introduced in 1.0.0 |
Event Title | Text | The title of the Datadog event. This field is required when the Action is "Post Event". | Introduced in 1.0.0 |
Event Text | Large Text | The body text of the Datadog event. This field is required when the Action is "Post Event". | Introduced in 1.0.0 |
Alert Type | Choice | The alert type of the event. This field is visible when the Action is "Post Event".
| Introduced in 1.0.0 |
Priority | Choice | The priority of the event. This field is visible when the Action is "Post Event".
| Introduced in 1.0.0 |
Tags | Text | Comma-separated list of tags in | Introduced in 1.0.0 |
Host | Text | The hostname to associate with the event. This field is visible when the Action is "Post Event". | Introduced in 1.0.0 |
Aggregation Key | Text | An arbitrary string used to aggregate related events in the Datadog event stream. This field is visible when the Action is "Post Event". | Introduced in 1.0.0 |
Source Type Name | Text | The source type name for the event (e.g., | Introduced in 1.0.0 |
Related Event ID | Text | The ID of a related Datadog event. When not set, the field is not included in the payload. This field is visible when the Action is "Post Event". | Introduced in 1.0.0 |
Query Mode | Choice | Determines how monitors are selected. This field is required and visible when the Action is "Get Monitor Status".
| Introduced in 1.0.0 |
Monitor ID | Integer | The integer ID of the monitor to query. This field is required when the Query Mode is "Monitor ID". | Introduced in 1.0.0 |
Monitor IDs | Text | Comma-separated list of monitor IDs to query (e.g., | Introduced in 1.0.0 |
Monitor Tags | Text | Comma-separated list of tags in | Introduced in 1.0.0 |
Monitor Name Search | Text | The name of the monitor to query. This field is required when the Query Mode is "Monitor Name Search". | Introduced in 1.0.0 |
Max Monitors | Integer | The maximum number of monitors to retrieve (range: 1–1000, default: 100). This field is visible when the Action is "Get Monitor Status". | Introduced in 1.0.0 |
Fail on Alert | Checkbox | When checked, the task ends with failure if any queried monitor is in Alert or Warn state. This field is visible when the Action is "Get Monitor Status". | Introduced in 1.0.0 |
Fail on No Data | Checkbox | When checked, the task ends with failure if any queried monitor has no data. This field is visible when the Action is "Get Monitor Status". | Introduced in 1.0.0 |
Include Group States | Checkbox | When checked, per-group state breakdowns are retrieved for composite monitors and displayed in the STDOUT table. This field is visible when the Action is "Get Monitor Status". | Introduced in 1.0.0 |
Log Message | Large Text | The message body of the log entry. This field is required when the Action is "Post Log". | Introduced in 1.0.0 |
Log Status | Choice | The severity level of the log entry. This field is visible when the Action is "Post Log".
| Introduced in 1.0.0 |
Service | Text | The name of the service that generated the log. This field is visible when the Action is "Post Log". | Introduced in 1.0.0 |
Hostname | Text | The hostname of the source that generated the log. This field is visible when the Action is "Post Log". | Introduced in 1.0.0 |
Log Tags | Text | Comma-separated list of tags in | Introduced in 1.0.0 |
Source | Text | The source of the log entry, mapped to the Datadog | Introduced in 1.0.0 |
Custom Attributes | Text | Additional attributes to include in the log payload, specified as comma-separated | Introduced in 1.0.0 |
Output Fields
The following output-only fields provide better visibility during the execution of Universal Task Instances.
Name | Type | Description | Version Information |
|---|---|---|---|
Event ID | Integer | The integer ID assigned to the posted event by Datadog. This field is populated when the Action is "Post Event". | Introduced in 1.0.0 |
Any Alerting | Checkbox | Indicates whether any queried monitor is in Alert or Warn state. This field is populated when the Action is "Get Monitor Status". | Introduced in 1.0.0 |
Monitor Summary | Text | A summary of monitor states in the format | Introduced in 1.0.0 |
Status | Text | The overall status returned by the action. | Introduced in 1.0.0 |
Environment Variables
Environment Variables can be set from the Environment Variables task definition table.
Environment Variable Name | Description | Version Information |
|---|---|---|
UE_HTTP_TIMEOUT | Specifies the timeout (in seconds) for HTTP requests made by the Task Instance. A higher value allows for slower responses, while a lower value enforces stricter time constraints. If not set, a default of 30 seconds is used. When a timeout occurs, the Task Instance ends in failure. | Introduced in 1.0.0 |
Exit Codes
Exit Code | Status | Description |
|---|---|---|
0 | Success | Successful execution. |
1 | Failure | General execution failure. Also raised when a configured failure condition is met (e.g., a monitor is in Alert state when Fail on Alert is enabled). |
2 | Failure | Authentication error. The configured API key is invalid (HTTP 401). |
3 | Failure | Authorization error. The configured key does not have sufficient permissions (HTTP 403). |
20 | Failure | Data Validation Error. |
21 | Failure | Network error. The Datadog endpoint could not be reached due to a connection failure or request timeout. |
22 | Failure | Not found. The requested resource was not found (HTTP 404) or the monitor query returned an empty result set. |
23 | Failure | Rate limit exceeded (HTTP 429). The |
24 | Failure | Unexpected HTTP error or malformed API response. |
STDOUT and STDERR
STDOUT displays a summary table of the action results. The content depends on the Action: Post Event prints the event ID and status; Get Monitor Status prints the monitor name, ID, and state for each queried monitor; Post Log prints the submitted log entry fields.
STDERR provides execution log details. The level of detail is controlled by the Log Level Task Definition field.
Backward compatibility is not guaranteed for the content of STDOUT/STDERR and can be changed in future versions without notice.
How To
Import Universal Template
To use the Universal Template, you first must perform the following steps.
For large Universal Templates, some parameters need to be adjusted, particularly for MySQL, Universal Controller and Universal Agent:
MySQL (my.cnf)
max_allowed_packet: Defines the maximum size of a single network packet. Recommended setting: at least 25% greater than the size of your largest imported integration.innodb_log_file_size: Determines the size of InnoDB redo log files. Recommended setting: ensure 10% of the log file size exceeds your largest imported integration.
Universal Agent Configuration (config/omss.conf)
max_msg_size: Specifies the maximum allowable size for messages. Recommended setting: at least 10% greater than your largest imported integration.
Universal Controller Configuration
Universal Controller configuration can restrict import of an integration if the extension maximum bytes is not properly set. This can be configured in the following ways:
- Universal Controller configuration file (tomcat/conf/uc.properties):
uc.universal_template.extension.maximum_bytes - Universal Controller UI Admin Panel: Administration → Properties → Universal Template Extension Maximum Bytes
Recommended setting: ensure the configured value is greater than the size of your largest imported integration.
The deployment of an integration from Universal Controller to Universal Agents, can also be restricted by the JVM heap size of the Tomcat serving the Universal Controller. Ensure to configure the JVM heap size adequately. Things to consider:
- # of agents configured to accept the extension(s).
- # of agents configured to deploy on-registration and how many would be registering simultaneously.
- # of parallel, on-demand deployments, where deployment happens the first time the extension needs to execute on a specific agent.
- This Universal Task requires the Resolvable Credentials feature. Check that the Resolvable Credentials Permitted system property has been set to true.
- Import the Universal Template into your Controller:
- Extract the zip file that you downloaded from the Integration Hub.
- In the Controller UI, select Services > Import Integration Template option.
- Browse to the "export" folder under the extracted files for the ZIP file (Name of the file will be unv_tmplt_*.zip) and click Import.
- When the file is imported successfully, refresh the Universal Templates list; the Universal Template will appear on the list.
Modifications of this integration, applied by users or customers, before or after import, might affect the supportability of this integration. For more information, refer to Integration Modifications.
Configure Universal Task
- Create a new Universal Task and enter the required input fields as defined in the Universal Template.
- Before creating the task, ensure any required external accounts, access tokens, or service credentials are available.
- Create the required Resolvable Credentials to be used as input fields in the Universal Task configuration.
Integration Modifications
Modifications applied by users or customers, before or after import, might affect the supportability of this integration. The following modifications are discouraged to retain the support level as applied for this integration.
- Python code modifications should not be done.
- Template Modifications
- General Section
- "Name", "Extension", "Variable Prefix", and "Icon" should not be changed.
- Universal Template Details Section
- "Template Type", "Agent Type", "Send Extension Variables", and "Always Cancel on Force Finish" should not be changed.
- Result Processing Defaults Section
- Success and Failure Exit codes should not be changed.
- Success and Failure Output processing should not be changed.
- Fields Restriction Section
The setup of the template does not impose any restrictions. However, concerning the "Exit Code Processing Fields" section.
- Success/Failure exit codes need to be respected.
- In principle, as STDERR and STDOUT outputs can change in follow-up releases of this integration, they should not be considered as a reliable source for determining the success or failure of a task.
- General Section
Users and customers are encouraged to report defects or feature requests at Stonebranch Support Desk.
Document References
Document Link | Description |
|---|---|
Datadog API documentation for the Events endpoint used by the Post Event action. | |
Datadog API documentation for the Monitors endpoint used by the Get Monitor Status action. | |
Datadog API documentation for the Logs intake endpoint used by the Post Log action. |
Changelog
ue-datadog-1.0.0 (2026-06-02)
Initial version.