UDMG Status
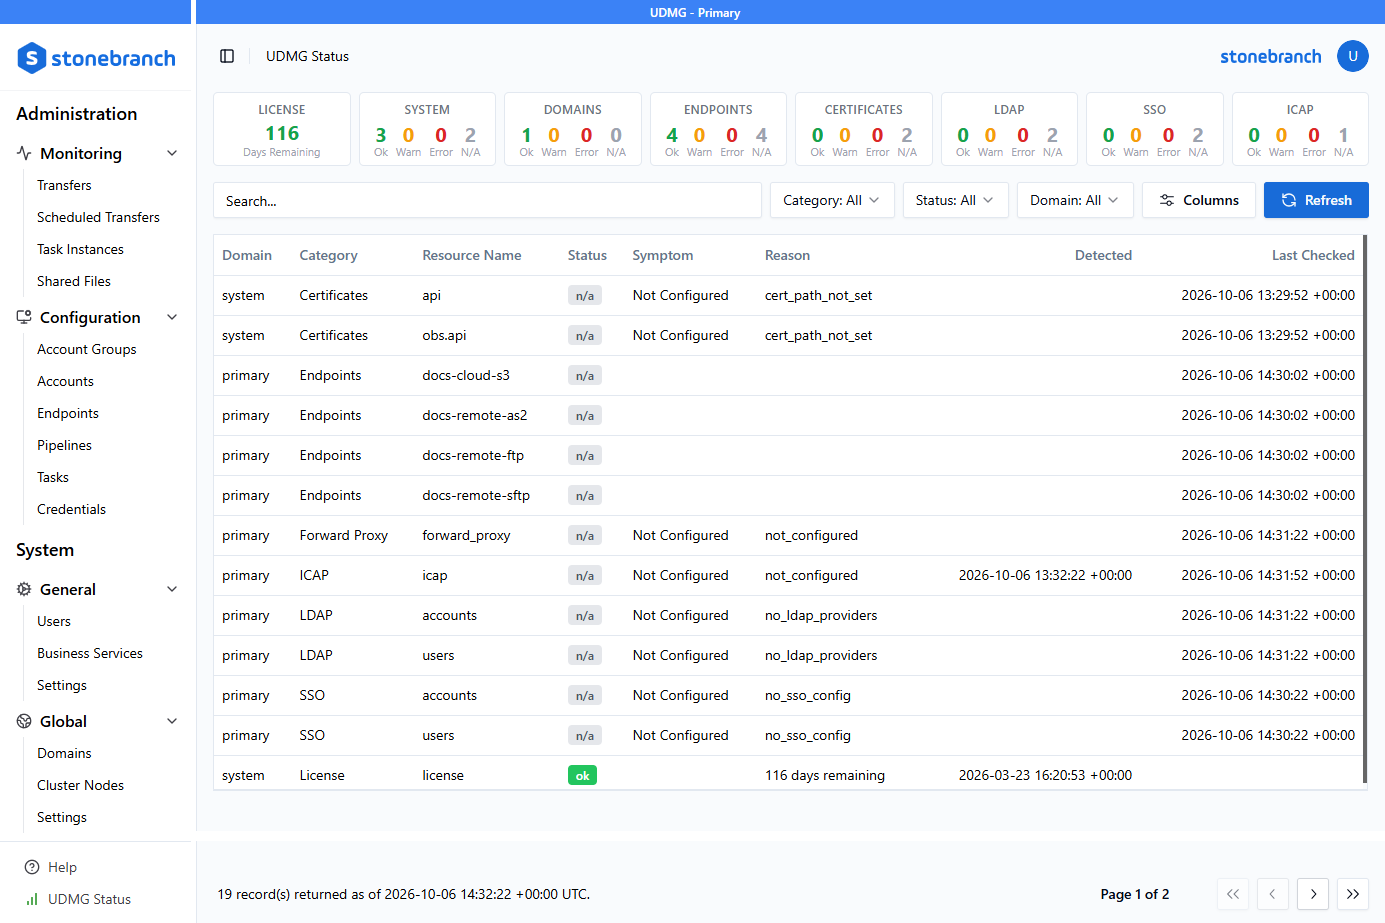
The UDMG Status page provides a real-time view of the health status of each UDMG resource (such as an Endpoint, Certificate, or authentication provider) across all Domains and Cluster Nodes. Each resource is listed as a record showing its current status, any detected symptom, and when it was last checked.
You can monitor resources from the UDMG Status page in the UDMG Admin UI.
Domains, Categories and Resource Names
Each resource belongs to a domain scope area and a category. The Domain column shows one of two values:
system: A built-in label for resources that operate at the system level, outside any specific Domain.systemis not a UDMG Domain. These resources are always present.- Domain name (for example,
primary): The name of a UDMG Domain. Resources with a Domain name are scoped to that Domain, and one set of these resources appears per Domain.
The primary Domain is always present by default, so domain-scoped resources always appear at least once, under the primary Domain.
Each resource also belongs to one of these categories:
- Certificates
- Cluster
- Database
- Endpoints
- Forward Proxy
- Hook Server
- ICAP
- LDAP
- License
- SSO
The following table lists all resources, their domain scope and category, and what each one monitors.
| Domain | Category | Resource Name | What It Monitors |
|---|---|---|---|
system | Certificates | api | Expiration of the system API TLS certificate configured in the Reports warn when expiring soon, error when expired. |
obs.api | Expiration of the Observability API TLS certificate configured in the Only present when Reports warn when expiring soon, error when expired. | ||
hook_server | Expiration of the Hook Server TLS certificate configured in the Only present when Reports warn when expiring soon, error when expired. | ||
| Cluster | Node UUID | Running state of a Cluster Node. One row per node. Only present in clustered deployments. The Detected column shows when the node started (the same value as Started in Cluster Nodes), while Last Checked shows when the health prober last ran, not when the node last sent a heartbeat (Last Update in Cluster Nodes). | |
| Database | database | Connectivity to the UDMG database. | |
| Hook Server | hook_server | Running state of the UDMG hook server used in AS2 protocol. | |
| License | license | Validity and remaining days on the UDMG license. | |
| Domain name | Certificates | Credential Name | Expiration of TLS Certificate Pairs assigned to local server endpoints (Local SFTP Server, Local FTP Server, Local AS2 Server, or Local HTTPS Server (WTC)). One row per credential. Reports warn when expiring soon, error when expired. |
| Endpoints | Endpoint Name | One row per endpoint. What is reported depends on the endpoint type. See Endpoint Resources. | |
| Forward Proxy | forward_proxy | Reachability of the configured Forward Proxy. | |
| ICAP | icap | Reachability of the configured ICAP Scanner. | |
| LDAP | accounts | Connectivity to LDAP for Accounts authentication providers. | |
users | Connectivity to LDAP for Users authentication providers. | ||
| SSO | accounts | Reachability of configured SSO for Accounts provider endpoints. | |
users | Reachability of configured SSO for Users provider endpoints. |
Endpoint Resources
What UDMG Status reports for an Endpoint resource depends on the type of endpoint.
Local Server Endpoints (Local SFTP Server, Local FTP Server, Local AS2 Server, and Local HTTPS Server (WTC)) have a live network listener. UDMG probes each one on the Endpoint probe interval and reports its running state:
- ok: the server is running or ready.
- warn: the server is starting up or draining active connections.
- error: the server has stopped unexpectedly.
- n/a (Disabled): a User stopped the Endpoint intentionally. This status does not affect the domain's overall health shown on the DOMAINS tile.
Local Filesystem Endpoints are probed on a separate interval (configured via healthcheck.probe.storage_disk). The resource shows ok when the path is accessible, or error if it cannot be read. Only enabled Local Filesystem Endpoints appear.
Remote Server Endpoints (Remote SFTP Server, Remote FTP Server, Remote AS2 Server) and Remote Cloud Storage Endpoints have no server process to probe. UDMG does not check their connectivity. These endpoints always show n/a in the Status column, and their status does not affect the domain's overall health.
A resource for a Remote Server or Remote Cloud Storage Endpoint appears when the endpoint is created and is removed when the endpoint is deleted.
Probes
Each resource category is checked on a fixed interval.
Default intervals and timeouts can be edited in the Configuration File, except for Cluster, whose interval is fixed at 30 seconds.
Monitoring Resources
To view the UDMG Status page, click UDMG Status at the bottom of the Sidebar.
Summary Tiles
At the top of the page, a row of summary tiles provides an at-a-glance breakdown of resource health. Each tile (except LICENSE) shows the count of resources split across four status buckets: OK, Warn, Error, and N/A.
| Tile(s) | Description |
|---|---|
| LICENSE | Shows the number of days remaining on the current license. |
| SYSTEM | Shows the count of system-level resources by status. System-level resources (those in categories such as Database, Cluster, and Hook Server) apply across all Domains. Clicking this tile filters the table to system-level resources. |
| DOMAINS | Shows the count of Domains by their overall status. Unlike other tiles, each number represents a Domain rather than an individual resource. Only visible to System Administrators. |
| ENDPOINTS, CERTIFICATES, LDAP, SSO, and ICAP | Shows the count of resources in that category by status. |
Click a tile to filter the table to show that tile's resources. Click the tile again to clear the filter and show all resources.
Search
Use the Search bar to filter resources by keyword. It only searches the Domain, Category, Resource Name, Symptom, Reason, and Message fields.
Filtering
Use the Category, Status, and Domain dropdowns to narrow the table to resources that match your selection. Filters can be combined with each other and with the Search bar.
Tile filters cannot be used together with the Category, Status, or Domain dropdowns. Selecting a tile clears any active dropdown filters, and applying a dropdown filter with an active Tile does not apply the filter.
Categories
Use the Category dropdown to filter the table to a specific resource category. See Domains, Categories, and Resource Names.
Status
Use the Status dropdown to filter resources by health status. Note that multiple statuses can share the same badge.
Further information is shown in the Symptom, Reason, and Message columns.
The following statuses are available:
| Status | Badge | Description |
|---|---|---|
| OK | ok | The resource is running normally. |
| Warn | warn | The resource is operational but attention is needed (for example, a license is expiring soon). |
| Error | error | The resource is not reachable or has failed. |
| Disabled | n/a | The resource is explicitly disabled. |
| Not Configured | n/a | The resource has not been configured. |
| Unknown | n/a | The resource status cannot be determined. |
Disabled, Not Configured, and Unknown all display as the n/a badge in the Status column. Use the Status filter to distinguish between them.
Domain
Use the Domain dropdown to filter the table to resources in the Primary or a Secondary Domain.
Columns
Click Columns to show or hide individual columns in the UDMG Status table. The following columns are available:
| Column | Description |
|---|---|
| Domain | The domain scope of this resource. See Domains, Categories and Resource Names. |
| Category | The resource category. |
| Resource Name | The specific identifier for this resource within its category. See the Domains, Categories and Resource Names table for the values used in each category. |
| Status | The current health status of this resource. |
| Symptom | A description of the current state (for example, "Not Configured" or "Active"). |
| Reason | A machine-readable code providing additional information about the current state (for example, not_configured or no_ldap_providers). |
| Message | Additional detail about the current state. Hidden by default. |
| Detected | The date and time the current state began. Only populated for resources that track state transitions across probe cycles:
For all other resources, this field is blank. Use Last Checked to see when the prober last ran. |
| Last Checked | The date and time the most recent probe ran for this resource. |
| Consecutive Failures | The number of consecutive failed probes for this resource. Hidden by default. |
Refresh
Click Refresh to reload the table with the most recent probe results. The table also refreshes automatically every 60 seconds.
Clicking Refresh does not trigger the prober. It only fetches results that have already been collected. To see updated results, wait for the next scheduled probe interval for that resource's category.
The footer of the table shows the total number of resources returned and the timestamp of the most recent evaluation.